

In 2000, Kodak and Fujifilm were nearly identical—same disruption, same technology access. Twenty years later, Fujifilm thrived; Kodak bankrupted. The difference wasn’t visible until too late.
The difference emerges when you map their ‘value circulation’ — the interplay of polarities that quietly determines whether a company adapts or collapses:
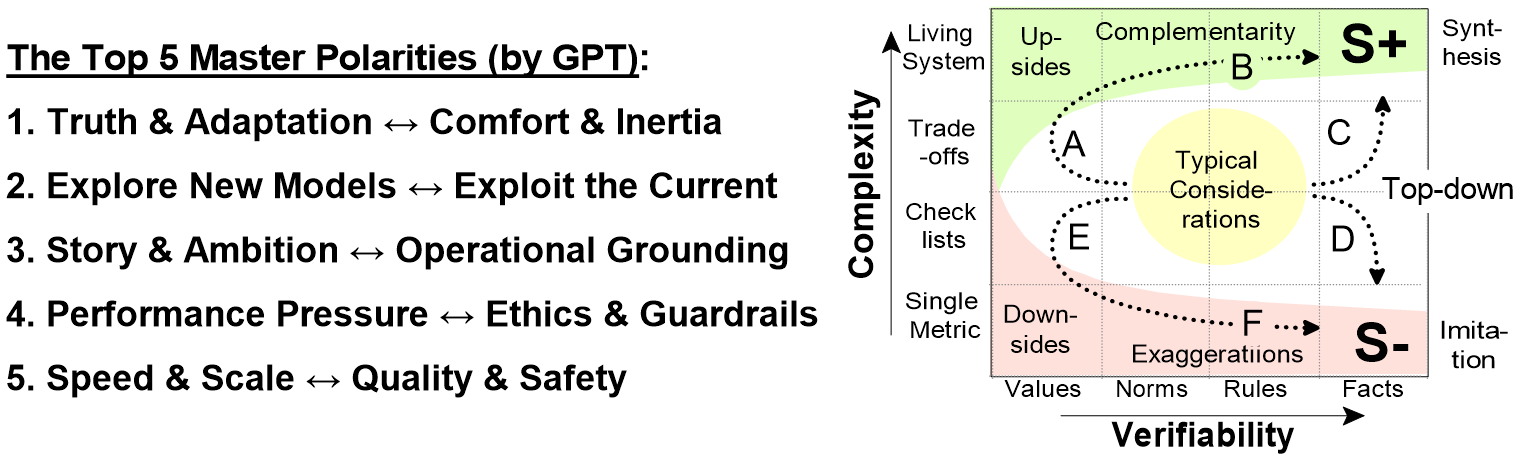
When a company’s values, strategy, and execution reinforce one another (A → B → C), it builds S+ — Adaptive Resilience. But when this alignment breaks, the system slides into S- — Sophisticated Imitation (D → E → F), often while KPIs still look deceptively strong.
Below, we introduce a 3-level diagnostic that turns these hidden patterns into actionable signals
LEVEL 1 — QUICK EXEC SCAN
A short, 15-minute leadership survey produces a polarity heatmap highlighting where the organization currently leans across five essential tensions:
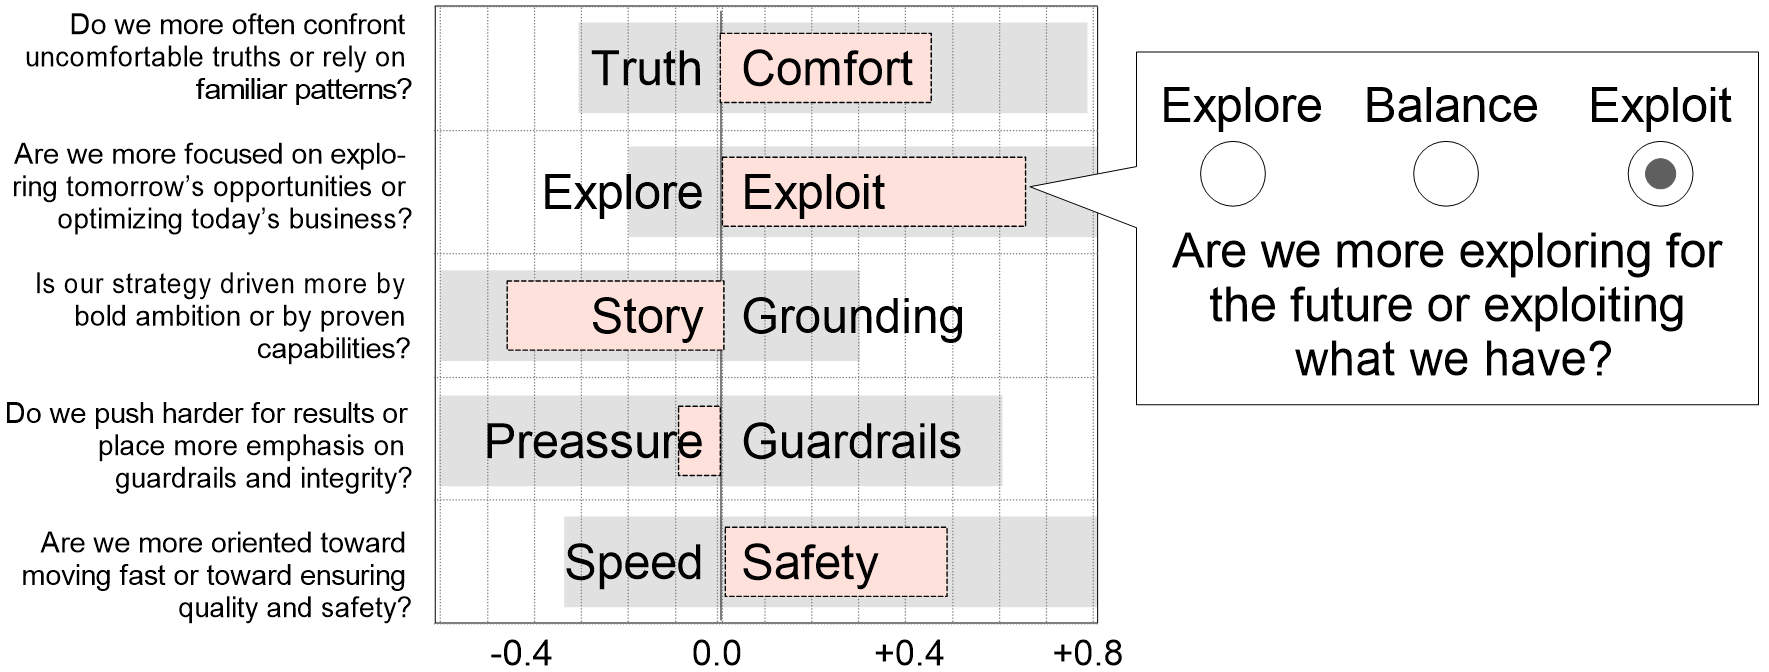
Level 1 focuses on directional imbalances — the “red areas” where one pole dominates and the system risks drifting out of alignment. Cross-case analysis suggests that these early signals alone can reveal 70–80% of latent structural issues:
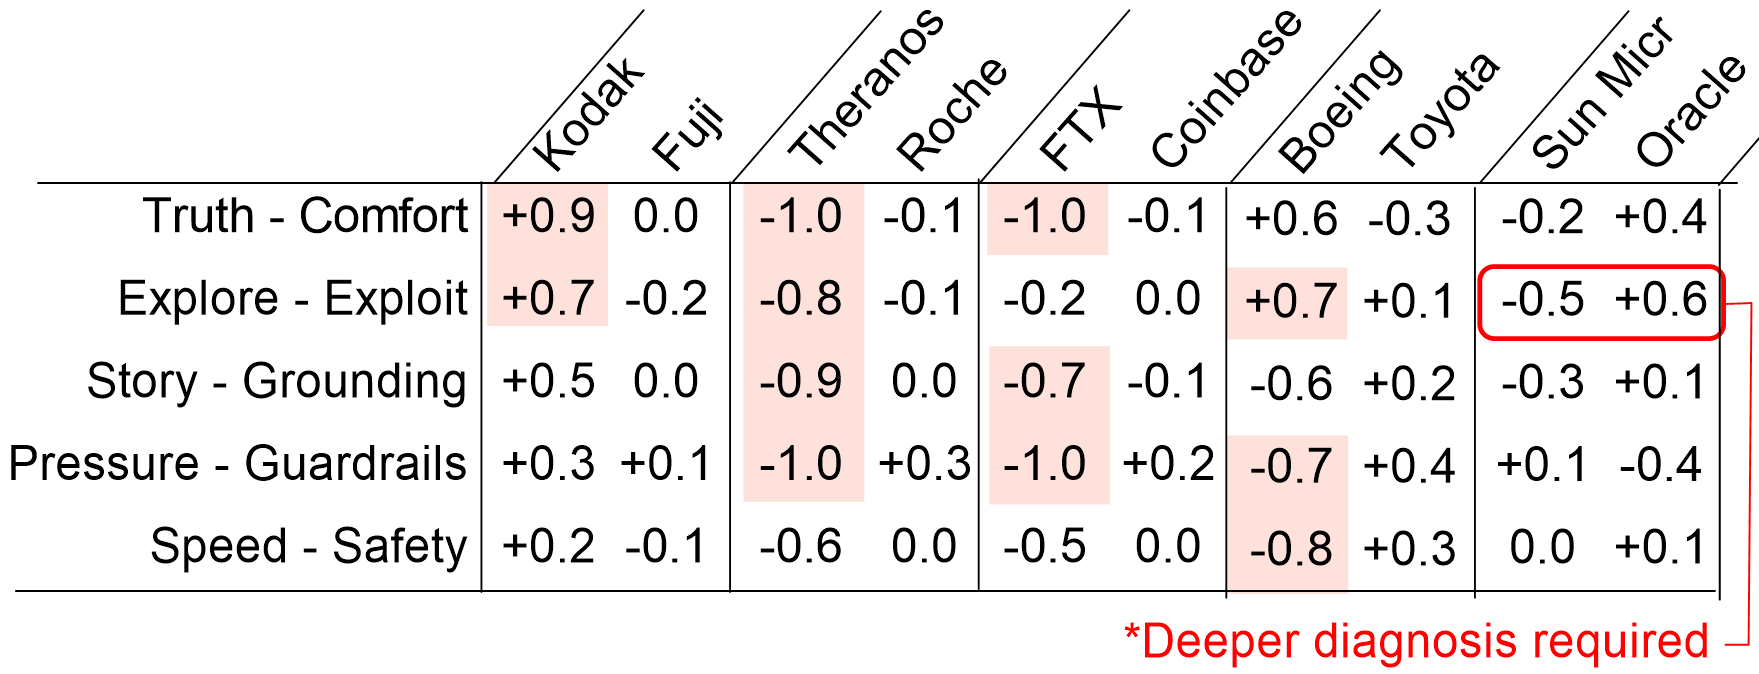
This table compares well-known contrasts:
- Kodak vs Fujifilm → same disruption, opposite reinvention
- …
- Sun Microsystems vs Oracle → same vision, opposite trajectories
Resilient companies cluster near the balanced zone (≈ 0.0 ± 0.4), while vulnerable ones lean toward one-sided extremes (beyond ±0.6, red zones). However, the Sun vs Oracle contrast shows that Level 1 is not sufficient on its own — Sun never crossed a clear red-line threshold, yet its underlying trajectory proved fragile. This is why the next level is essential.
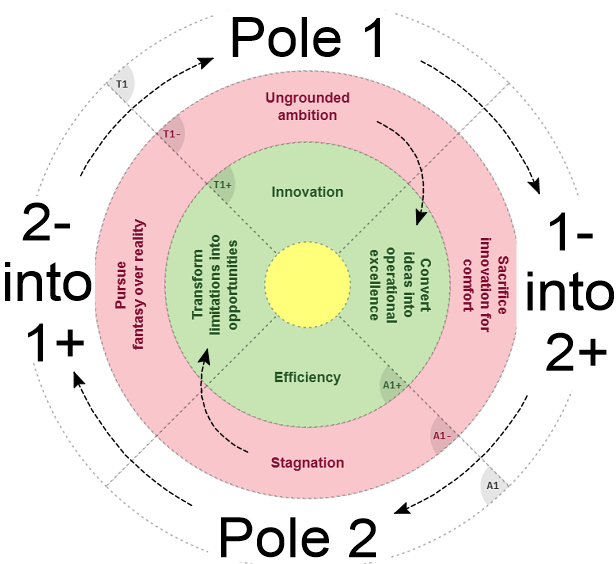
LEVEL 2 — THE POLARITY QUADRANT
Level 2 is the “why” behind the lean (offered by Polarity Partnerships). Each polarity is assessed across four dimensions:
- Upside of Pole 1 (T⁺) — the strength we want
- Downside of Pole 1 (T⁻) — the overuse trap
- Upside of Pole 2 (A⁺) — the complementary strength
- Downside of Pole 2 (A⁻) — the rigidity trap
For example, in the Explore ↔ Exploit polarity:
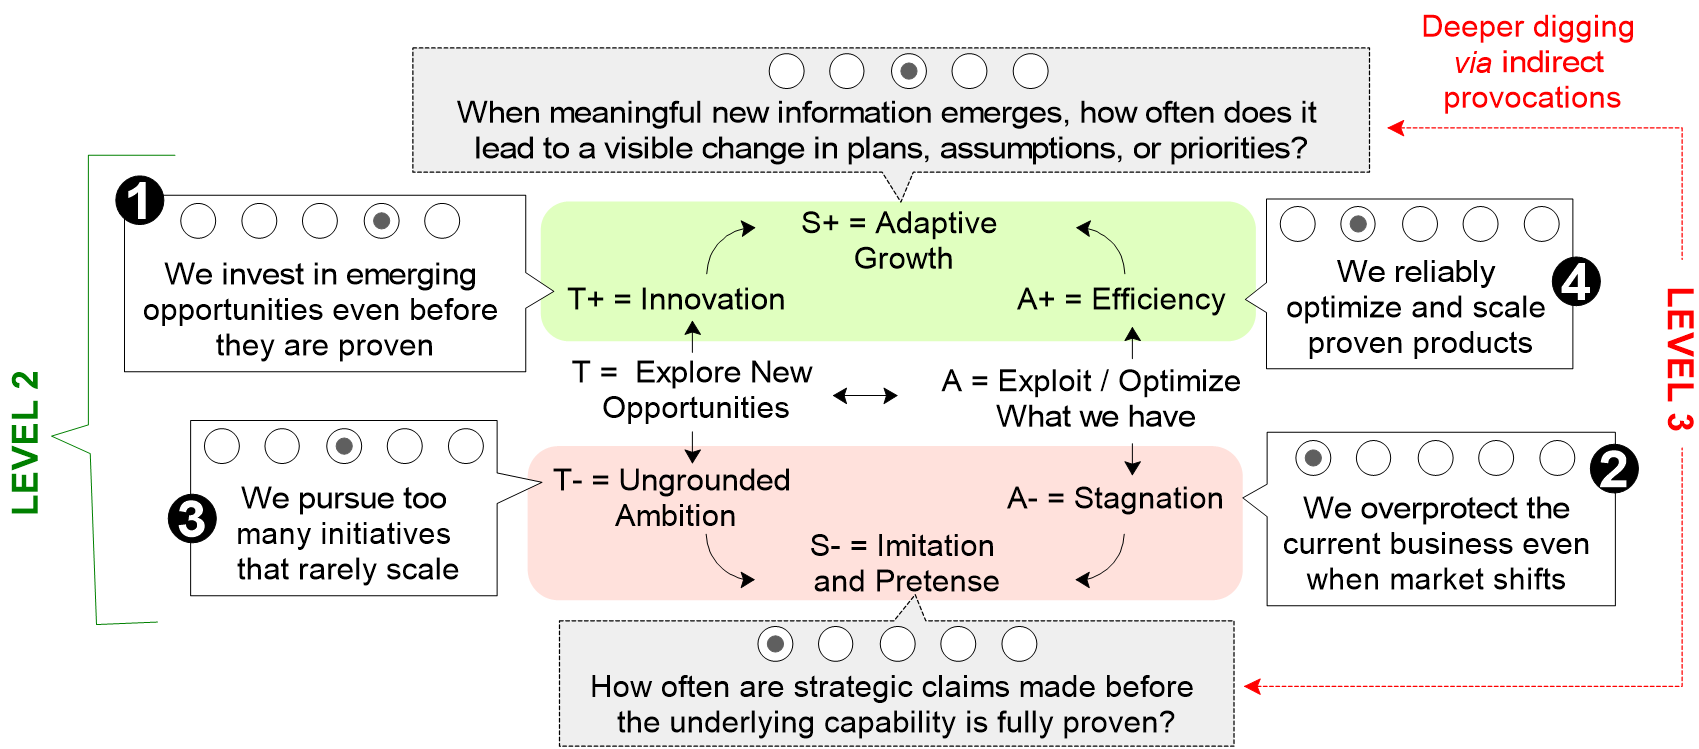
Level 2 distinguishes cases like Sun Microsystems vs. Oracle. Sun showed T– (ungrounded ambition) — exploring without validation — while Oracle showed A+ (disciplined scaling) — exploiting proven models with operational rigor.
LEVEL 3 — Trajectory & Integrity Assessment
Level 3 reveals the hidden patterns — whether the organization is compounding capability (S⁺) or sliding into sophisticated imitation (S⁻). It requires three types of insights (all of which can be enhanced by AI tools):
- Trajectory questions (do we update strategy based on reality or justify the existing story?)
- Integrity questions (do we prove capabilities before declaring success?)
- Corrective mechanisms (how to shift from S- to S+ by rebuilding self-regulating loops):
A) AI-enhanced synthesis tools:
- Dialectical Wheels → convert downsides into upsides
- Polarity Synthesis → define the smallest actions that make both poles strengthen each other
- AI Idea Generation (Bryan Cassady) → generate diverse, contradiction-resolving options
B) Human-Centered Evolution Tools
- Lean & Toyota Kata → rebuild evidence-based evolution
- TRIZ → resolve structural contradictions
- Corporate Rebels / Haier model → unlock bottom-up micro-innovation
- Agile leadership → correct overshoot toward inertia or overcontrol
AI tools surface hidden patterns, but they work best when combined with traditional metrics and human judgment.
Data Gathering Methods
- AI-assisted text and pattern analysis (e.g., Deloitte Culture Beacon or CultureBERT or McKinsey’s QuantumBlack
→ surface hidden behavioral and process patterns that predict drift toward S⁺ or S⁻. - Anonymous polarity assessments (Polarity Partnerships)
→ aggregate patterns without social pressure or signaling. - Structured Dialogic Design (SDD & Jeff Diedrich 7 Letters)
→ reveals bottom-up insights that normally stay hidden. - Psychological safety interviews (Harvard / Amy Edmondson)
→ uncover how freely truth flows through the system. - Premortems & red-team sessions (Gary Klein)
→ stress-test assumptions before they become expensive errors. - Market-signal cross-checks
→ compare internal narratives with objective external feedback. - Analysis of strategies and OKRs (Structured Dialectics)
→ consider blind spots of any statements.